Introduction to Scrutiny

In a nutshell

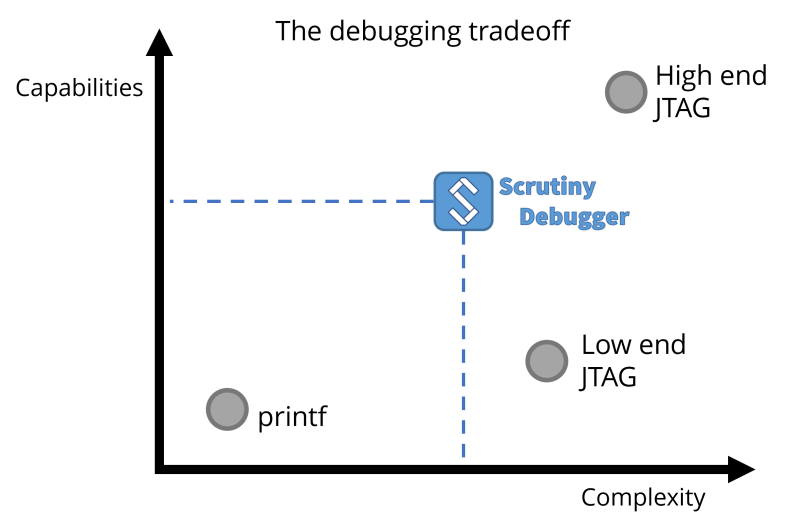
When it comes to debugging an embedded application, establishing a functional debugging environment can be challenging. More often than not, JTAG tools are either proprietary and expensive, or free but difficult to use, and sometimes even ineffective. Ignoring the cost factor, professional JTAG software can be overly complex and cumbersome to automate.

These issues frequently lead developers from smaller companies or hobbyists to rely on a working console output and resort to basic ‘printf’ debugging. Scrutiny presents a viable alternative for efficient debugging and tuning of an embedded application.

Complexity vs capabilities

Certain applications are critical and cannot be halted or accessed via JTAG while in operation. A good example would be a drone controller. As the drone is in flight, the debugging process must not interfere with the application to prevent potential hardware damage. Obviously, connecting a wired JTAG is hardly feasible during flight.

So how do we handle this? Scrutiny does not interfere with the original application, because it works through instrumentation. Breakpoints are not possible, and memory accesses occur synchronously within the embedded application. The developer dictates when Scrutiny instrumentation's is executed, and sets its execution priority. Memory regions can be marked as forbidden or read-only, to avoid tampering with any critical memory section.

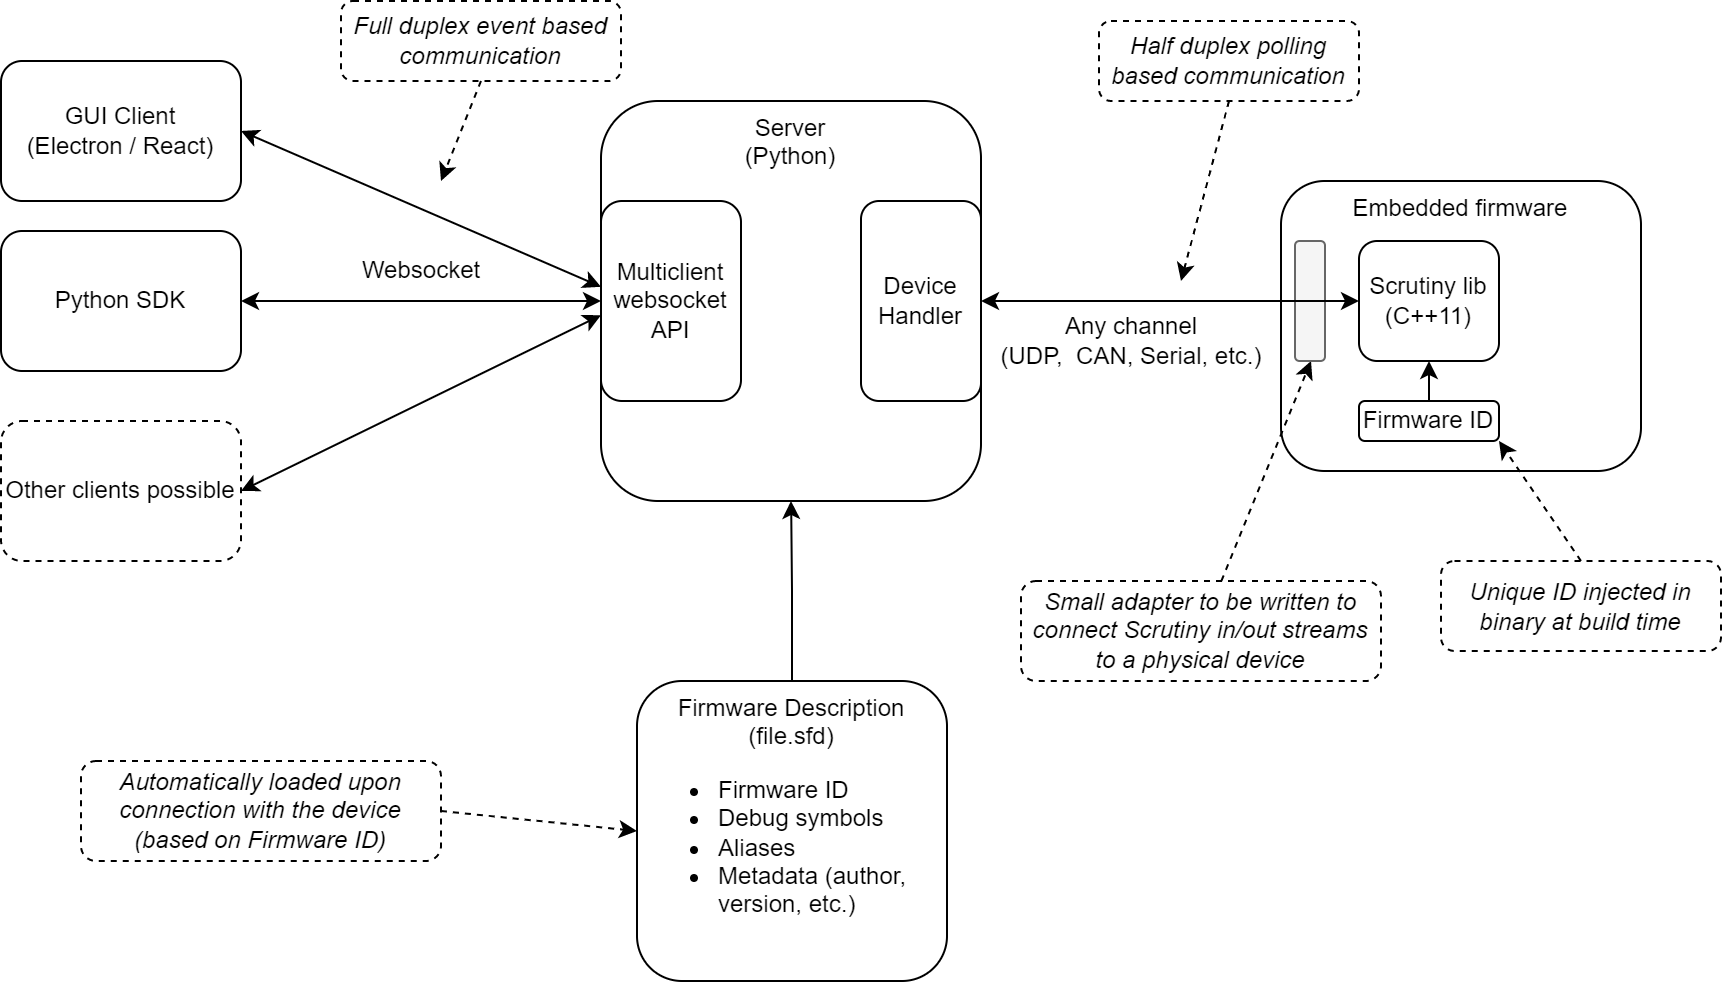
Lastly, Scrutiny operates through the communication channel already present on your hardware. Therefore, if you have Wifi, or a wireless serial port, Scrutiny can utilize that channel to communicate with its debug server. There's no need for additional proprietary hardware.

A concrete example, please!

Consider the following C++ code.
// file1.cpp
int some_global_var = 123;
void some_function(void)
{
    // volatile prevents unused variable to be stripped by the optimizer
    volatile static bool must_print = false;
    volatile static int counter = 0;
    if (must_print)
    {
        must_print = false;
        counter++;
        std::cout << "some_global_var=" << some_global_var << std::endl;
    }
}

It may seem that invoking some_function() will never print anything, right? Unless, of course, the device memory is being tampered with... That's exactly what Scrutiny will do. Here's what this will look like in the GUI

Demonstration video

In the demo above, we see that the variables have been auto-discovered using the application debug symbol. Writing must_print made the counter go up and printed to the console.
For this demonstration, a dummy binary that connect the Scrutiny Lib to the server with a UDP socket has been used.
We can also notice 2 additional folders. RPV and aliases

Icon Type Description
Variable Variables discovered in the binary by the Scrutiny toolchain using the compiler debugging symbols
RPV (Runtime Published Values) Readable and writable elements defined by the embedded firmware and identified by a 16 bits ID. They are published during the handshake phase with the server and reading/writing them triggers a user defined callback.
RPVs are available even when no SFD file matching the firmware is installed on the server machine since they are declared by the device upon connection.
Alias An abstract variable that can point to an actual variable or a RPV.
Aliases are useful to maintain a consistent interface across different firmware versions of a same firmware when a user (either a human or a script) expects a variable to exist.
For automatic testing, aliases are essentials.

How did Scrutiny found the variables in our example above? As mentioned, it utilizes the debugging symbols from the compiler, which means the build toolchain needs to be slightly modified to include the Scrutiny stage after linking.
Note that an application must be compiled with debugging symbols (generally, the with the -g option). Once the Scrutiny toolchain has produced its artifacts, the debugging symbols can be removed from the final binary with a command such as objcopy --strip-debug firmware.elf

Build process

What's inside?

Scrutiny has 3 main components

Embedded library
A C++11 library that must be invoked by the user's firmware periodically. This library has 2 streams of data (in and out) that must be connected to the external world via a hardware channel such as serial port, CAN bus, IP socket, etc.
Python server
A server that communicates with the device being debugged. It exposes all debugging information about the device through a multi-client websocket API. This server is a powerful extension of a limited resources device.
Client (GUI or SDK)
A software that communicates with the server through a websocket. It can subscribe to variables, trigger graphs, request the device status, write the memory, and more.

When a server connects to a device, a handshake phase is initiated. During this phase, the device shares its unique identifier generated at the time of build, along with its configuration. The unique identifier is used to load a Scrutiny Firmware Description (SFD) file from a database local to the server. The configuration provides the server with information about the device's capabilities such as: Protocol version, buffer sizes, maximum bandwidth, enabled features, etc.

A SFD is a file generated during the build process of the embedded firmware. It contains the debugging symbols, the firmware unique ID (a hash), the aliases definition (which we will discuss later) and additional metadata such as the author's name, version number, build date, and so forth

Architecture diagram

Graphing, your new best friend

Scrutiny has the ability to make a graph of the variables/RPV/Aliases exposed by the server.
Two types of graphs are possibles

Client graph

This graph is generated by the client. Each time the server broadcasts a value update, the sample is logged. The update rate of the server is determined by the bandwidth of the device communication link. The faster the link, the quicker the server can poll the device for a memory dump and the quicker the values are updated.

This type of graph can capture long acquisitions (ranging from minutes to hours, and even days). However, the sampling rate is dictated by the bandwidth of the device communication link, meaning that it won't be stable and decrease with the number of element being watched. Fast event may be missed.

Embedded graph

The embedded graph works differently. As the name suggests, the embedded device will take care of logging the variables. This feature is especially useful to catch a fast event or follow the evolution of internal state variable, like a state machine

A buffer dedicated to datalogging must be given to scrutiny-embedded. When a graph request is received, the device will start filling this buffer like a circular one until the graph trigger condition is met. It will then continue to log until the event is at the requested position in the buffer, allowing to see before or after the event.

Unlike the client graph, the communication device link is not a limitation for the embedded graph, but the size of the buffer is. The sampling rate will be steady and reliable (unless your firmware task is jittery), but the length of the acquisition will depend on the amount of memory allocated to datalogging and also the number of signal being logged.

The figures below depict how the embedded graph feature can be configured.

my_var
Fictive embedded variable that evolves over time.
Trigger condition
A user defined condition that must evaluate to true for the given hold time to fires the trigger event.
Hold time
The amount of time that a trigger condition must evaluate to true before firing the trigger event.
Buffer length
Length of the acquisition defined by the datalogging buffer size and the number/type of the logged signals.
Trigger position
Position of the trigger event inside the acquisition window specified in percentage where 0% is leftmost, 50% center and 100% rightmost. When on left, the user can see what happened after the event, and before the event when on right.

Look at it in action!

For more information about embedded graphs integration in a firmware, see the Instrumenting a software section